Projects Portfolio
Coseismic Landslide Probability Modeling
For my master’s capstone project, I estimated coseismic landslide probability for an M9 Cascadia Subduction Zone Earthquake in the Lower Bogachiel River Valley near Forks, WA. I calculated coseismic landslide probability based on 30 earthquake scenarios and a USGS empirical model.
Skill Highlights:
- Wrote Python scripts for calculating coseismic landslide probability (Figure 1)
- Analyzed overlap between coseismic landslide probability models in QGIS (Figure 2)
- Created a GitHub repository to preserve Python code and input datasets for reproducing project work
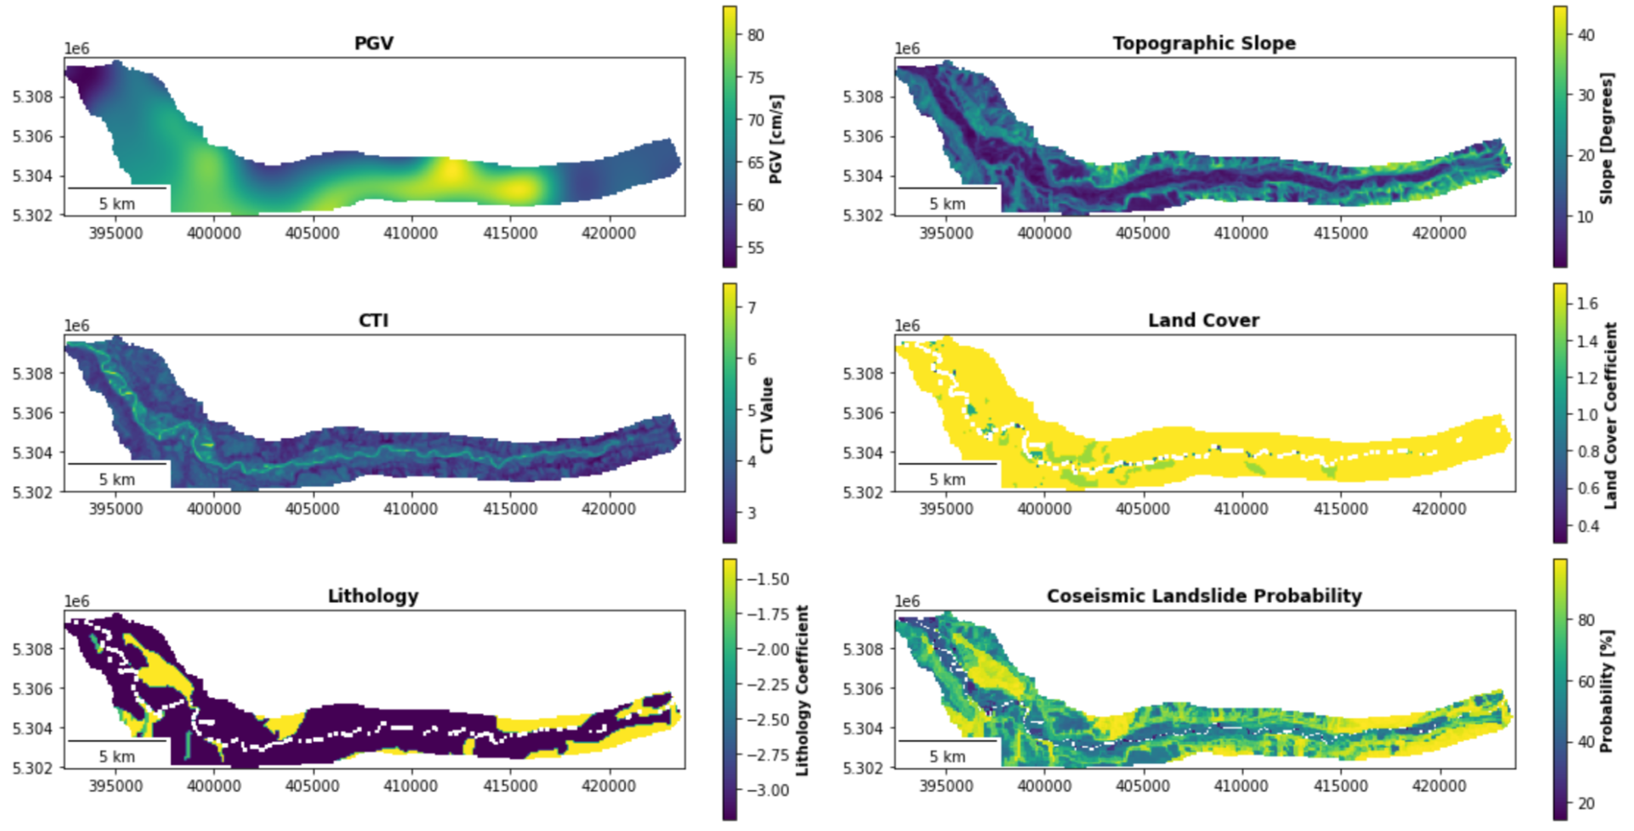
Figure 1: Plots of input datasets and one coseismic landslide probability model.
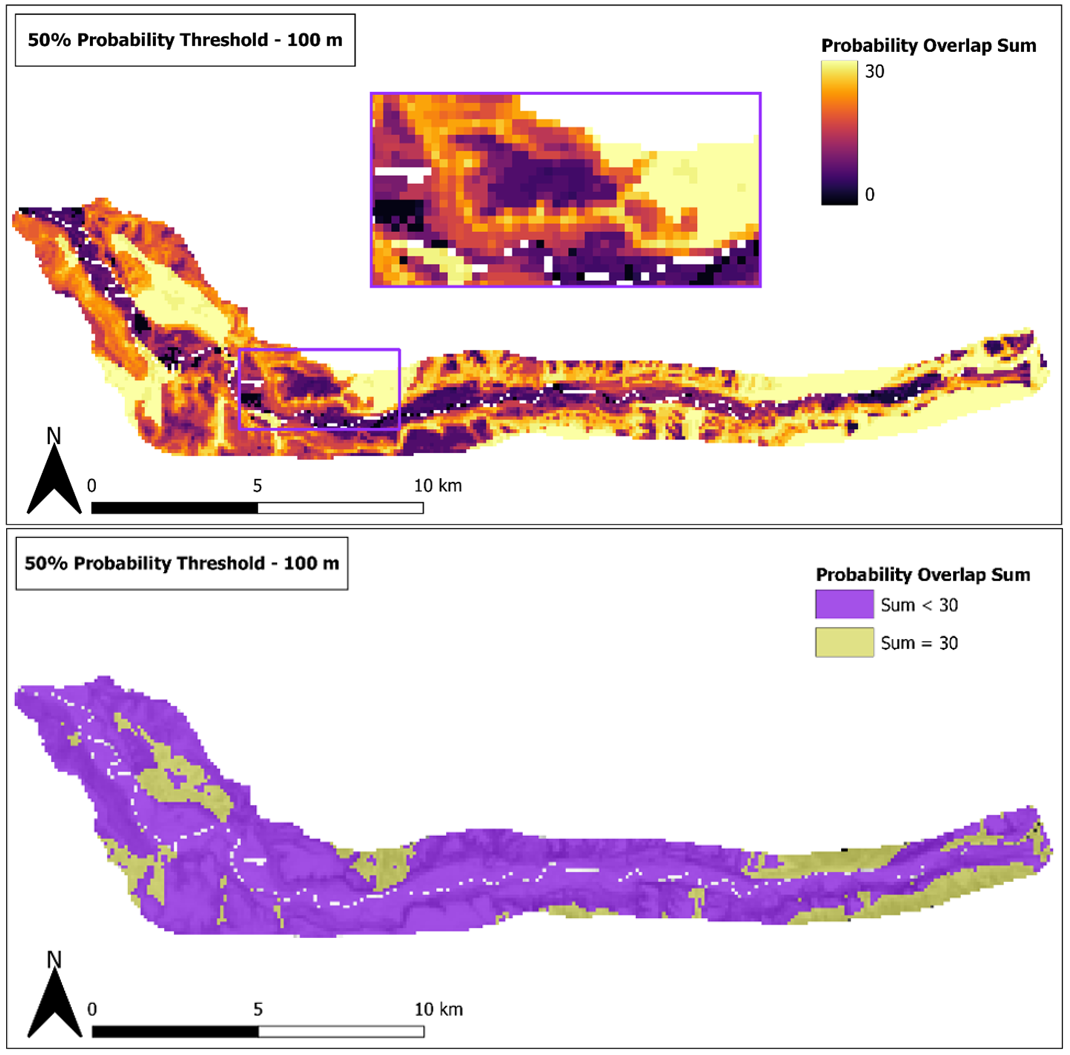
Figure 2: Maps showing the overlap between 30 coseismic landslide probability models for a 50% probability threshold.
Field Research at Undi Rd near Forks, WA
While attending graduate school in the Master’s in Applied Geosciences program at the University of Washington, I collected field observations with members of my cohort at Undi Rd near Forks, WA. I also had the opportunity to assist with GIS-related needs for course projects and additional research in the Lower Bogachiel River Valley.
Skill Highlights:
- Created timelapse series of the Bogachiel River and active Undi Rd landslide with the Google Earth Engine Python API (Figure 3 & Figure 4)
- Designed digital field maps with ArcGIS for data collection in Avenza Maps (Figure 5)
- Assisted cohort members and advisors in other applied geoscience projects
Figure 3: Timelapse series for Landsat imagery using a shortwave infrared band combination.
Figure 4: Timelapse series for Sentinel-2 imagery using a shortwave infrared band combination.
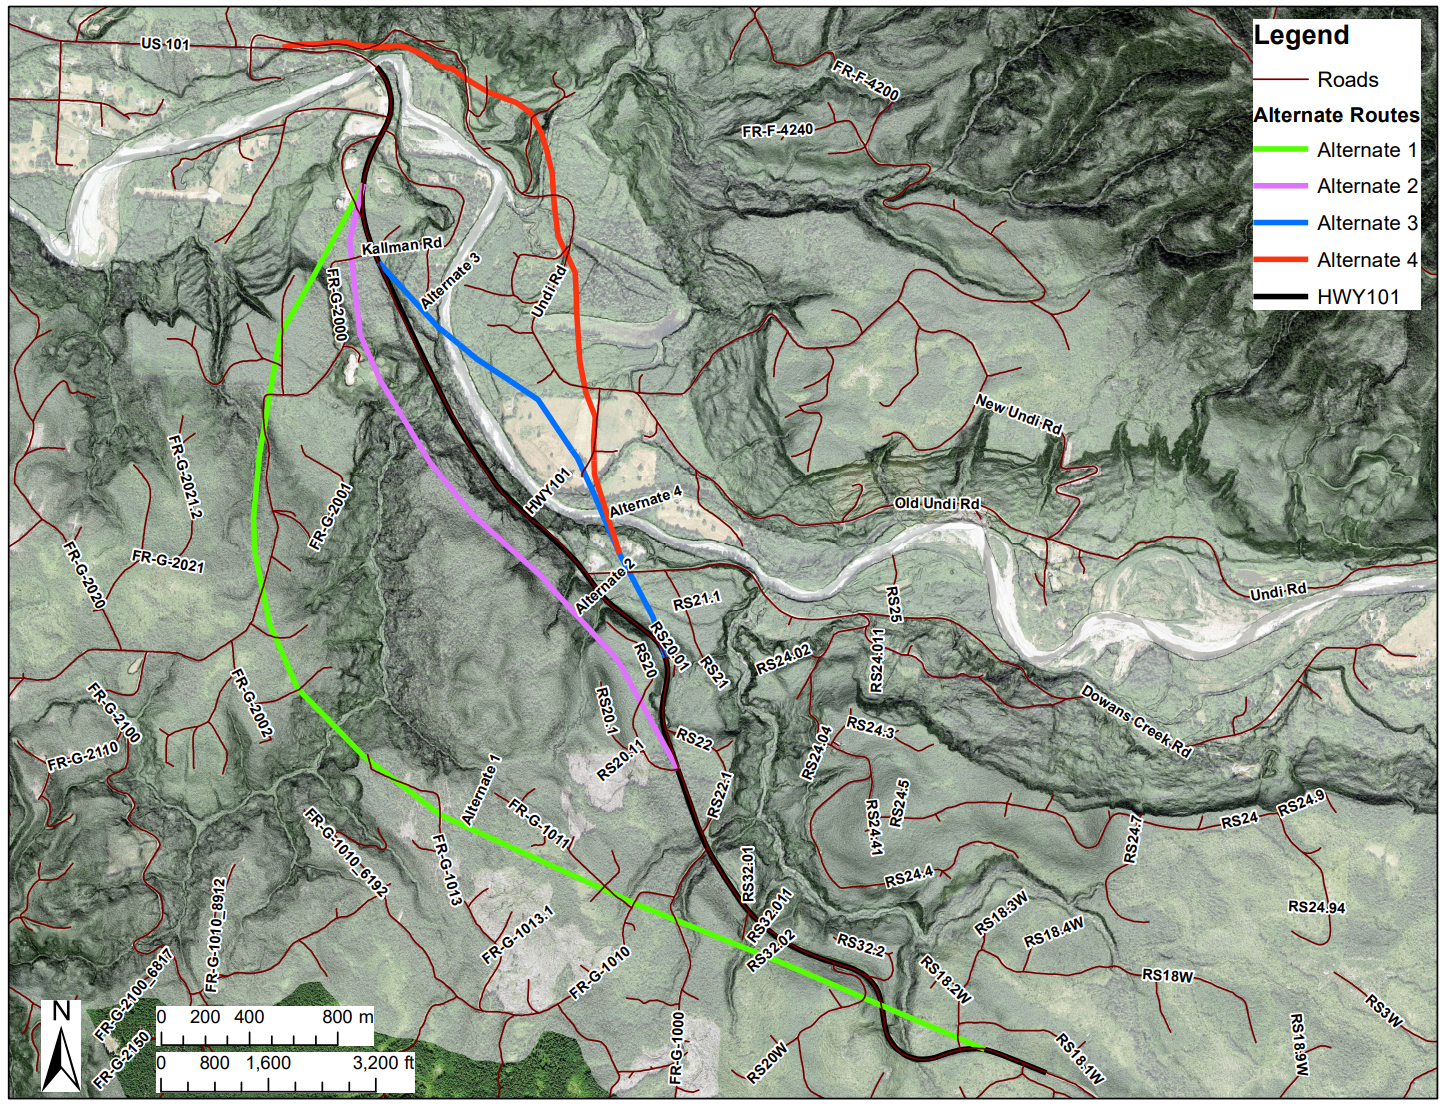
Figure 5: Digital field map of the Undi Rd study area with NAIP imagery overlaid by a low transparency LiDAR shaded relief layer.
Seismic Station Mapping
At the Pacific Northwest Seismic Network, I worked on GIS projects to update and present seismic station maps. The GIS projects motivated me to learn effective practices for data management and geoprocessing automation.
Skill Highlights:
- Developed methods for updating geodatabases and station maps with ArcGIS and Python
- Designed ArcMap templates to produce physical and digital maps with complex symbology (Figure 6)
- Worked with field engineers and research seismologists to create report maps (Figure 7)
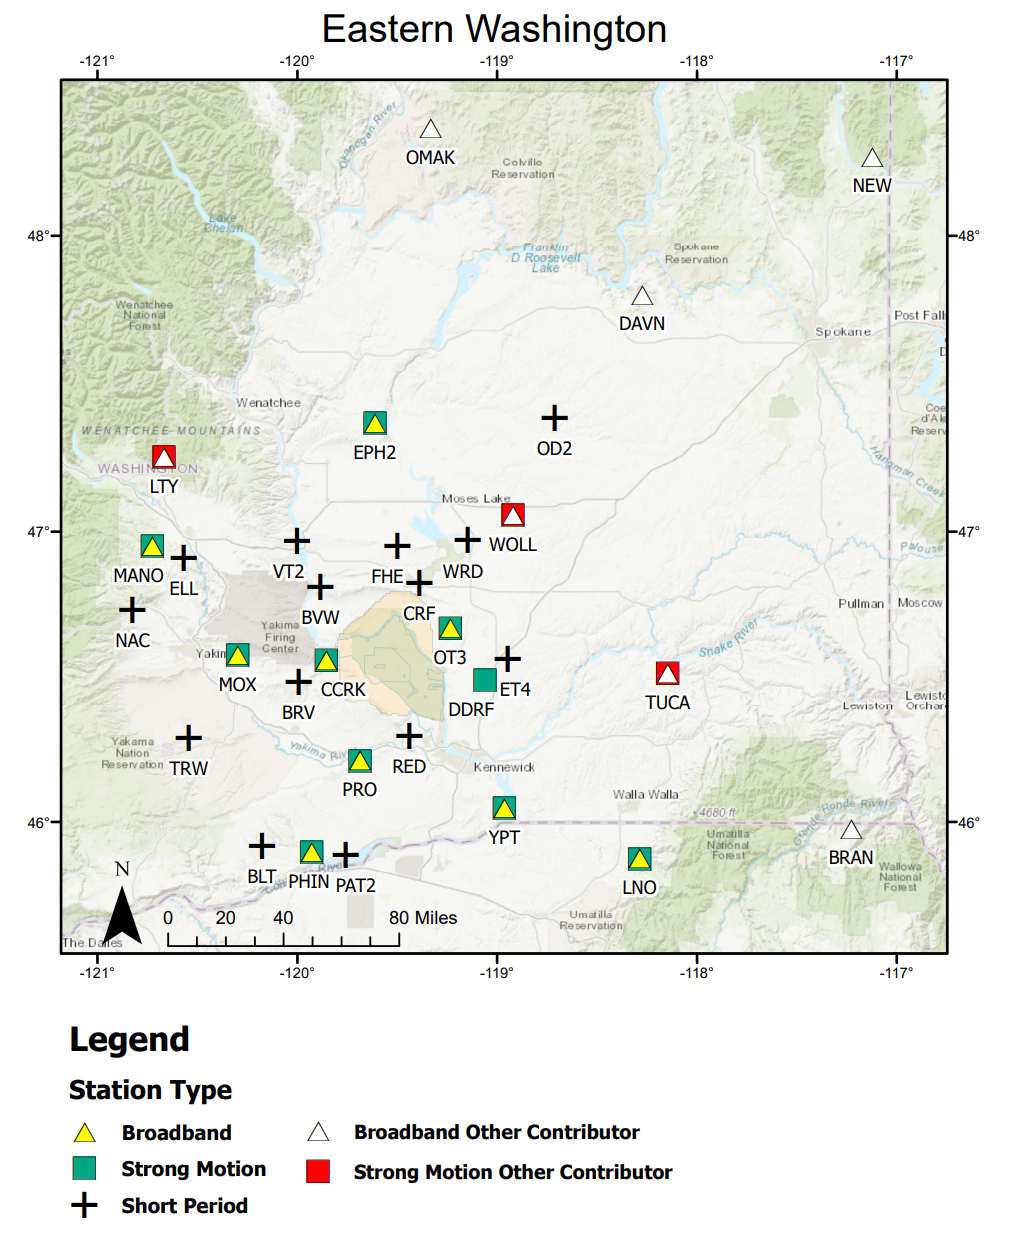
Figure 6: Seismic station map created for a report on Eastern Washington.
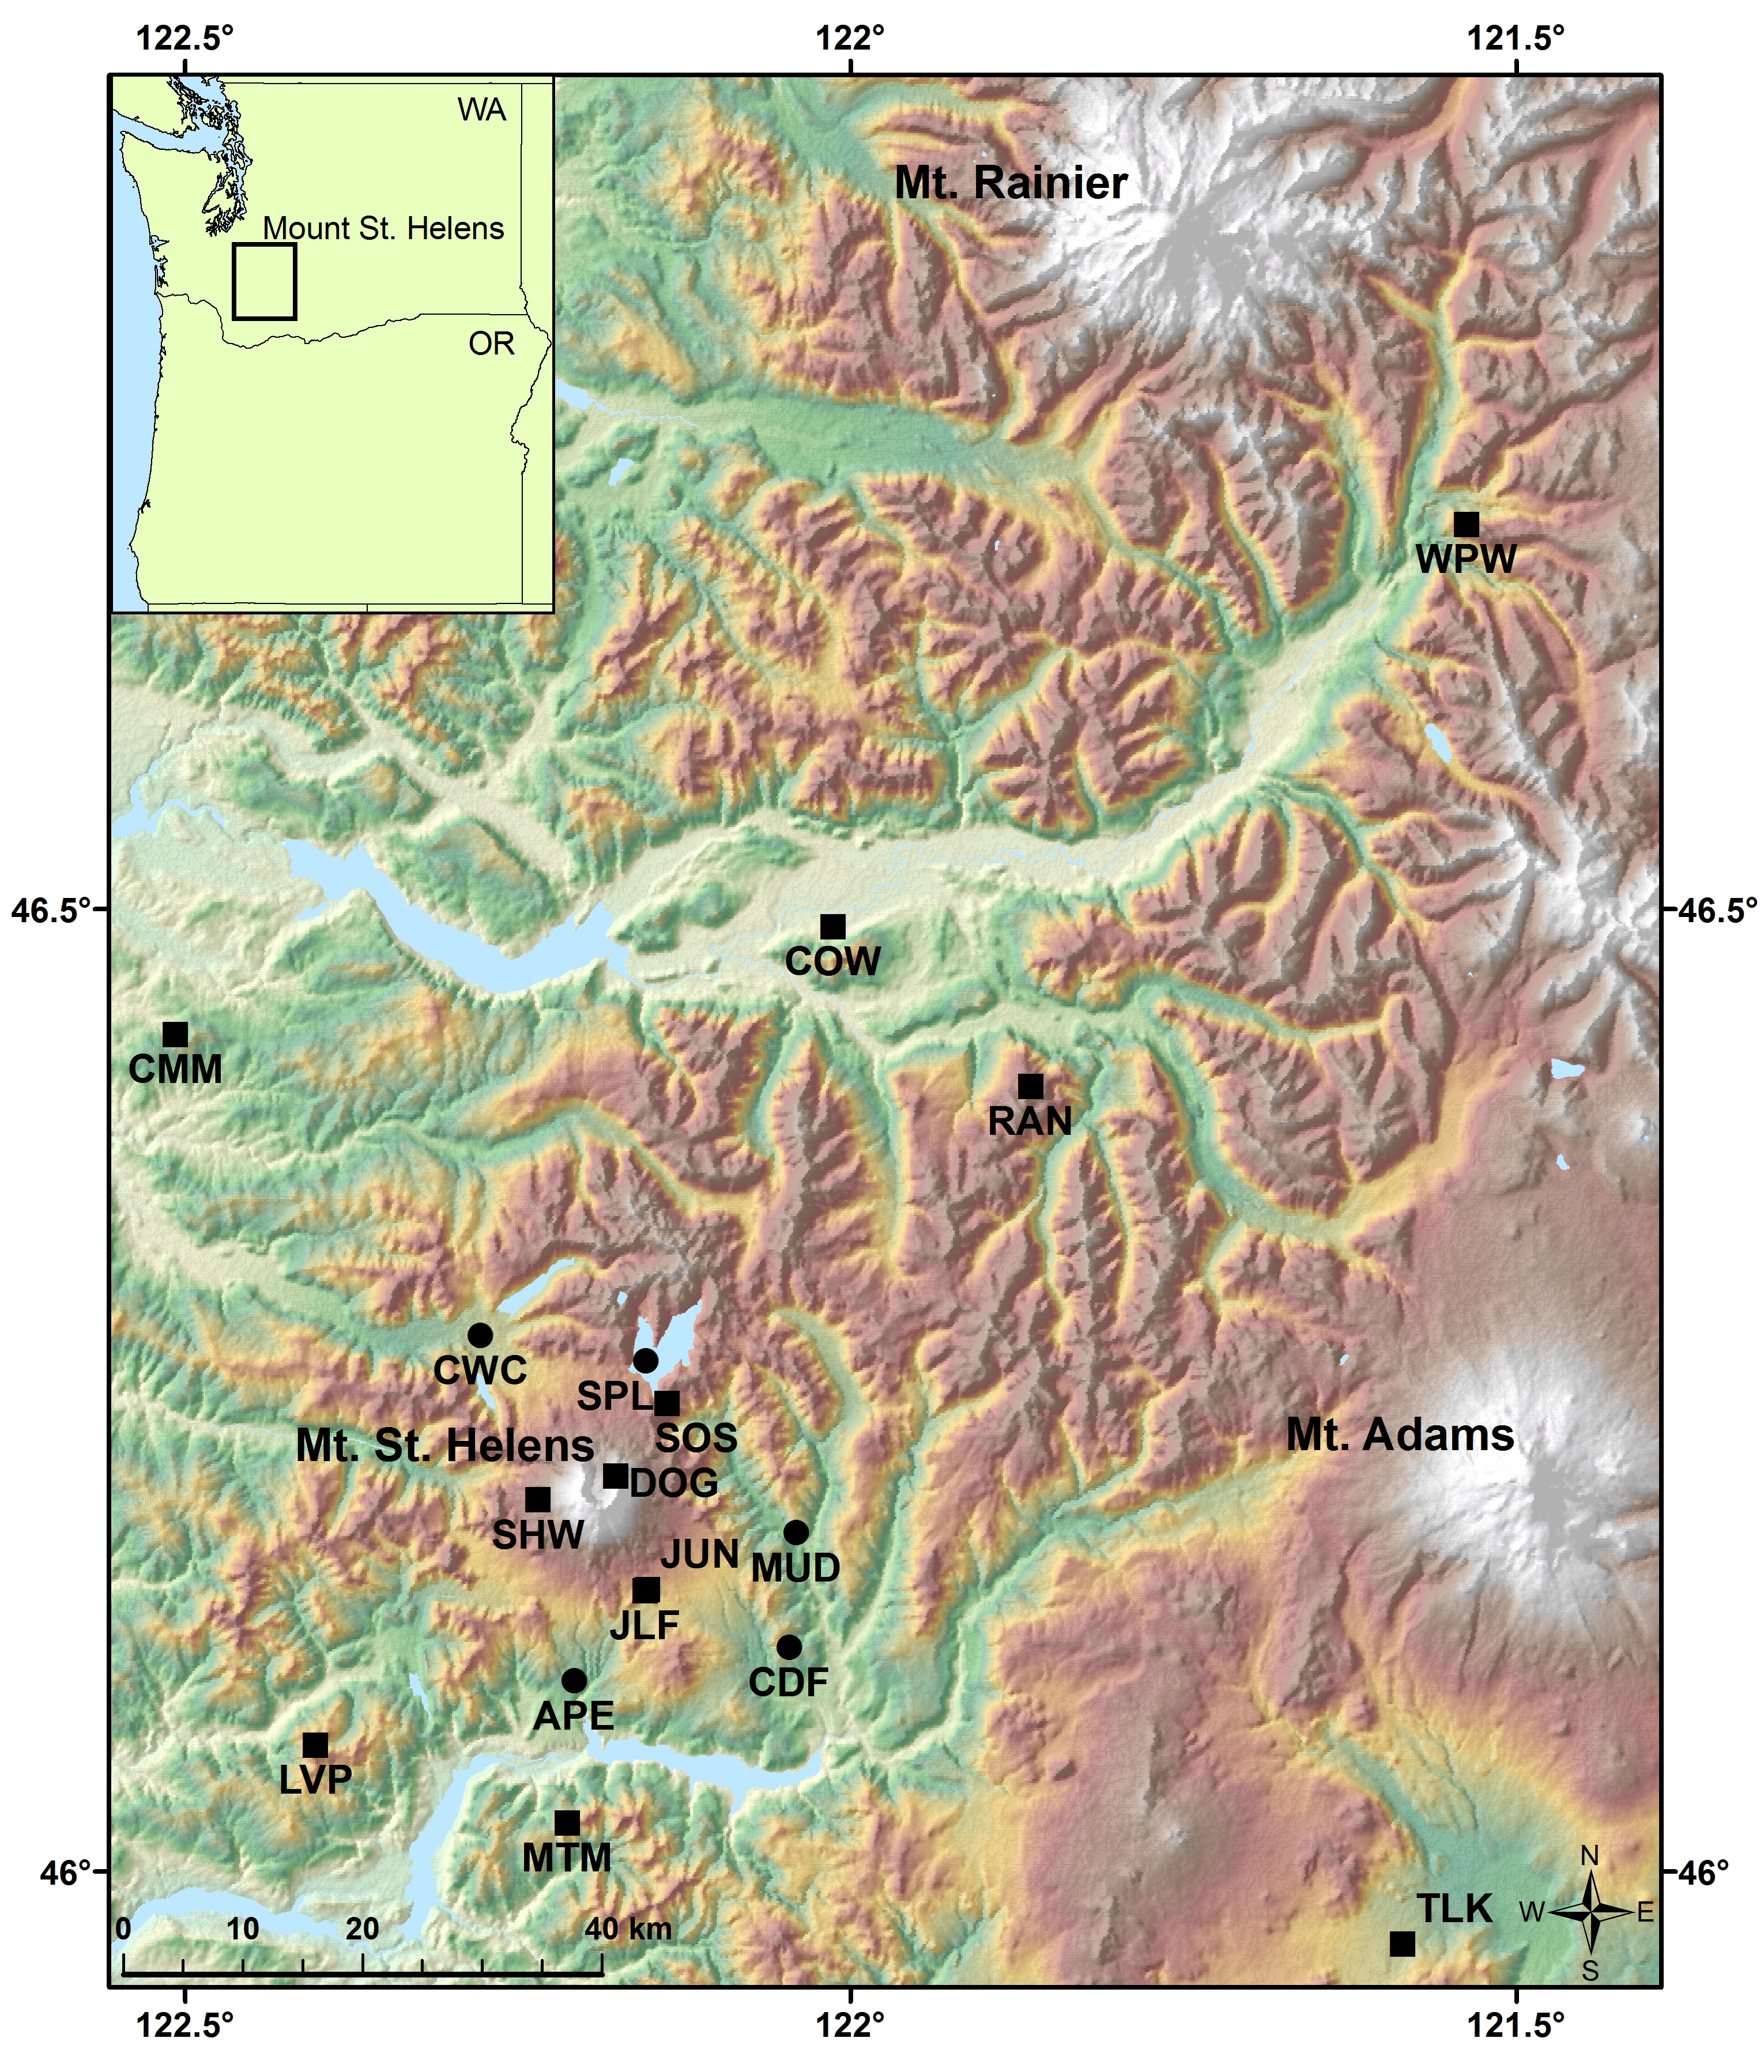
Figure 7: Map designed for a presentation on the 1980 Mount St. Helens eruption with historic seismic stations.
Surveying at Discovery Park in Seattle, WA
Throughout my collegiate career, I pursued surveying and remote sensing coursework to learn methods for creating geospatial data. Most of my courses included fieldwork at Discovery Park in Seattle, WA, to provide hands-on surveying experience and examine geologic hazards.
Skill Highlights:
- Collected and processed terrestrial LiDAR data of the Magnolia Bluff at Discovery Park with Riegl RiSCAN Pro (Figure 8)
- Conducted an sUAS survey of Discovery Park and produced a structure from motion model with Pix4D (Figure 9)
- Visualized and analyzed point cloud datasets in CloudCompare (Figure 10)
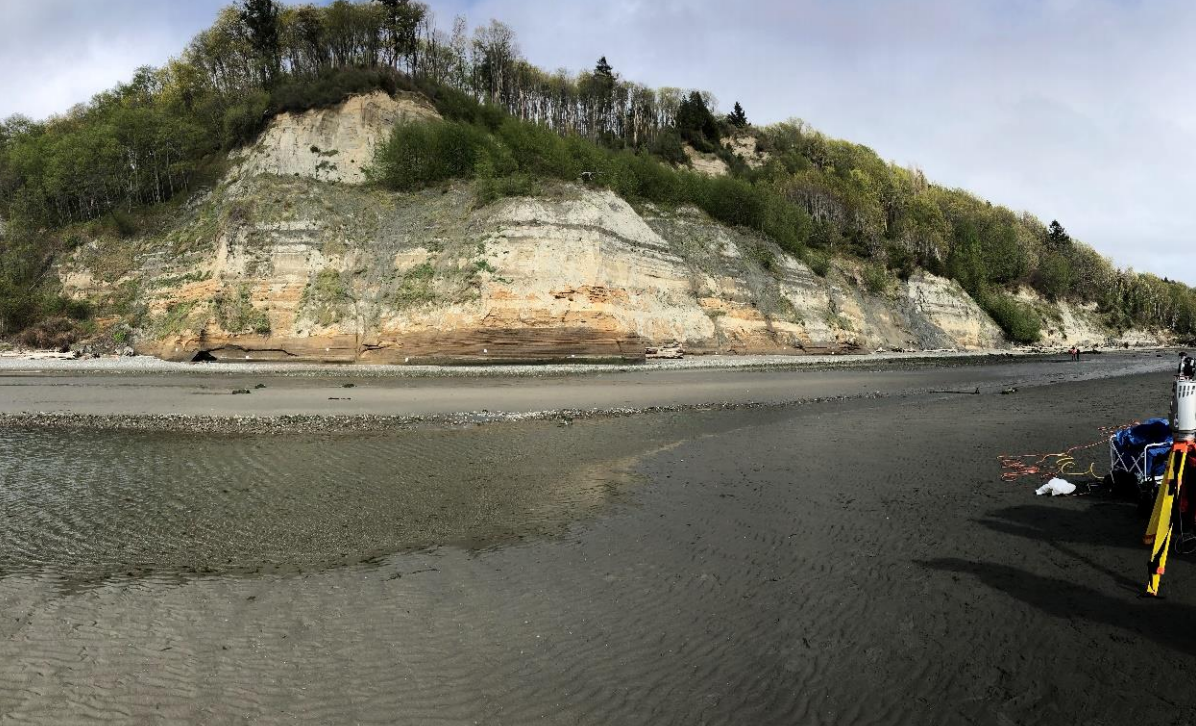
Figure 8: Picture of the Magnolia Bluff and a Riegl VZ-4000 taken April 2019.
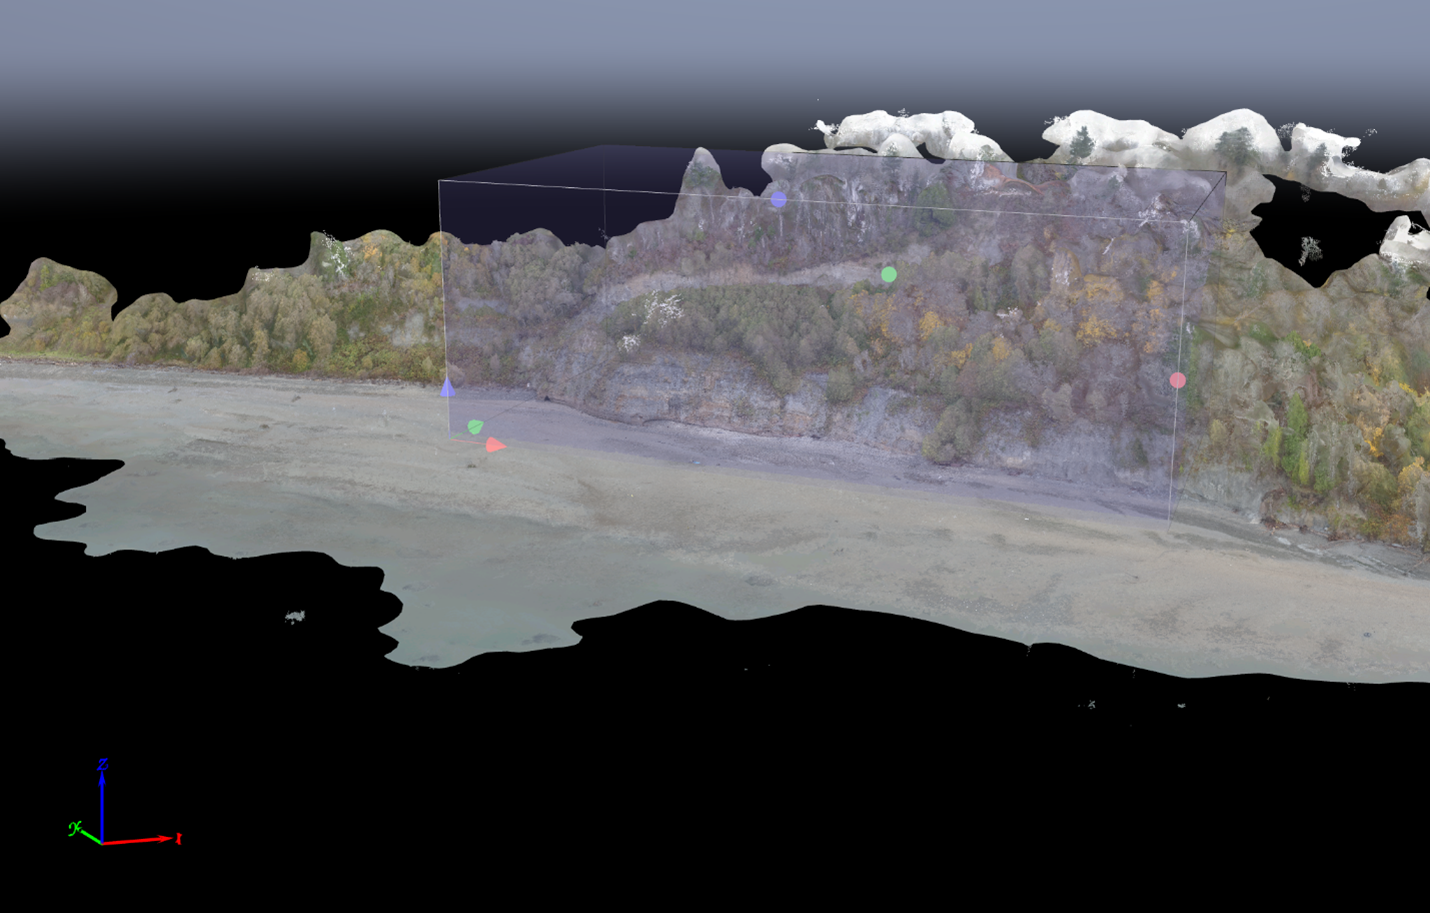
Figure 9: Image of a structure from motion model in Pix4Dmapper for an sUAS survey conducted during Autumn 2021.
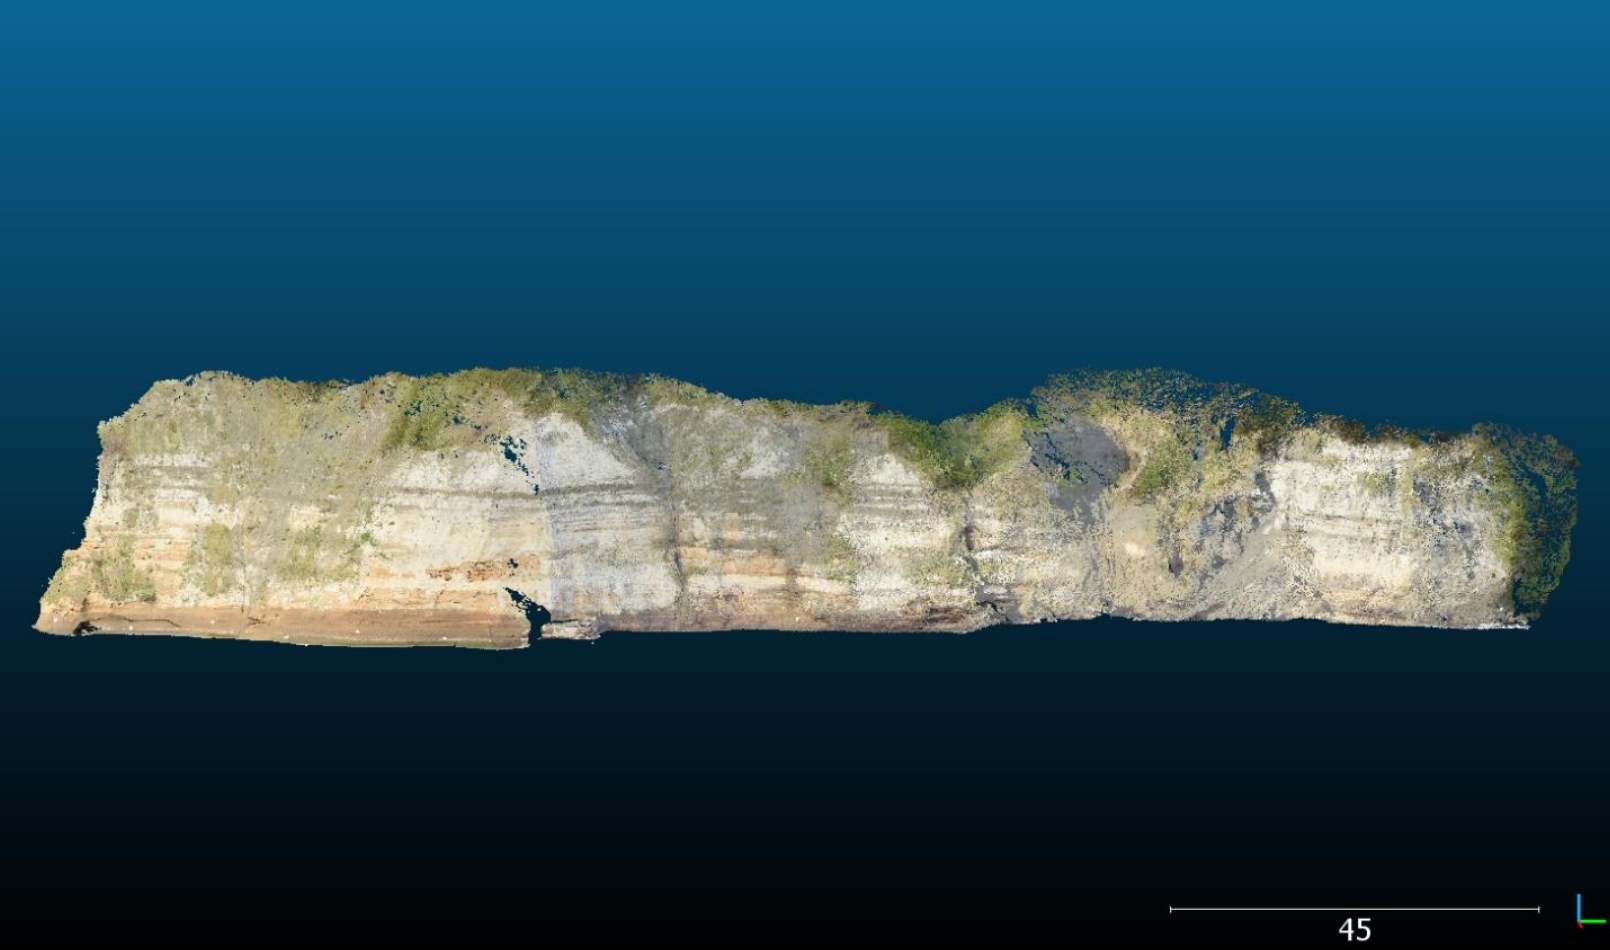
Figure 10: Image of a LiDAR point cloud in CloudCompare of the Magnolia Bluff.